

Track Claude Code
usage per developer
Claude Code now reports usage per developer: sessions, lines, tokens and cost, by name. That tells you who spent, not what the spend got done. Jenzo joins every Claude Code session to the ticket it worked on, the kind of work and the cost of what shipped, across Codex and Cursor too.
What Claude Code's analytics show, and what they miss
Give Anthropic its due. On the Team and Enterprise plans and in the Console, Claude Code reports usage per named developer, and there is a Claude Code Analytics API for the same numbers. The problem is not that the data is missing. It is that the data stops at the person. It never reaches the work.
Claude Code's own analytics
Console, Team and Enterprise dashboards, plus the Analytics API
- Per developer, by name or email
- Sessions, lines of code, commits, pull requests
- Tokens and an estimated cost, by model
- Accept and reject rates
What it cannot tie the usage to
The questions a manager actually asks
- Which ticket or task the usage was for
- What kind of work it was: a bug, a feature, a migration, a report
- Whether that work shipped, or which client it was for
- A shared API key, which shows as one key, not a person
- A personal Claude Max seat used at work, invisible to the org
- Codex, Cursor and Gemini CLI, each in its own separate dashboard
See Claude Code usage per developer
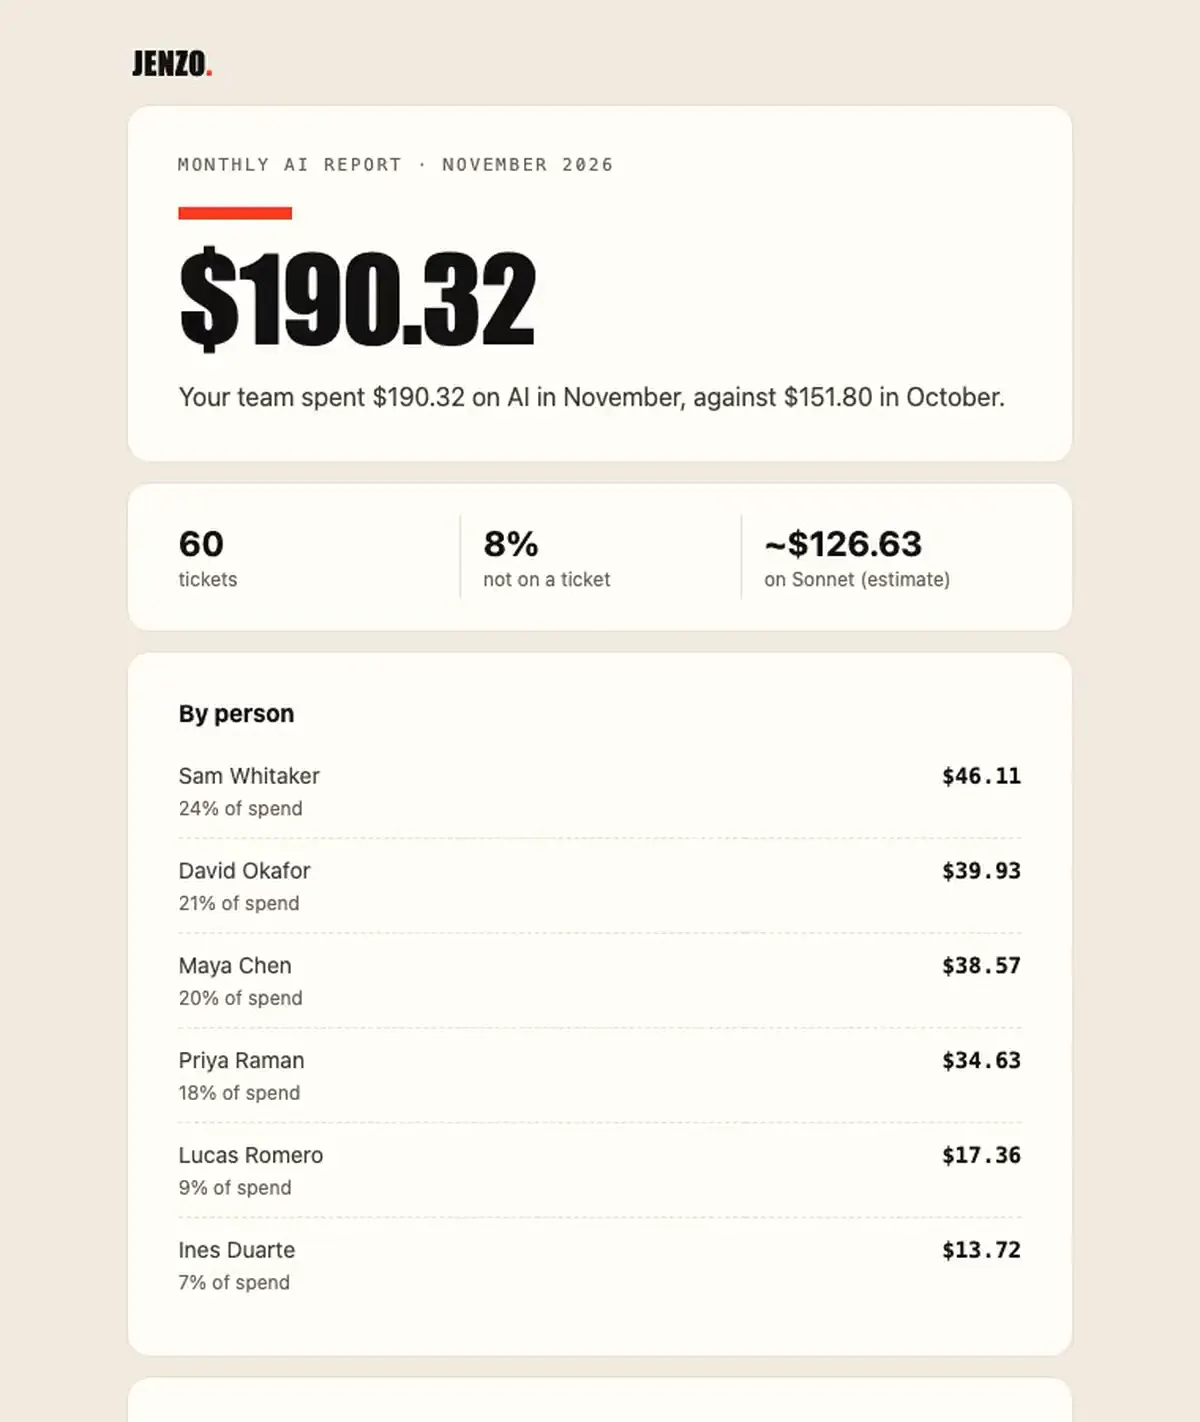
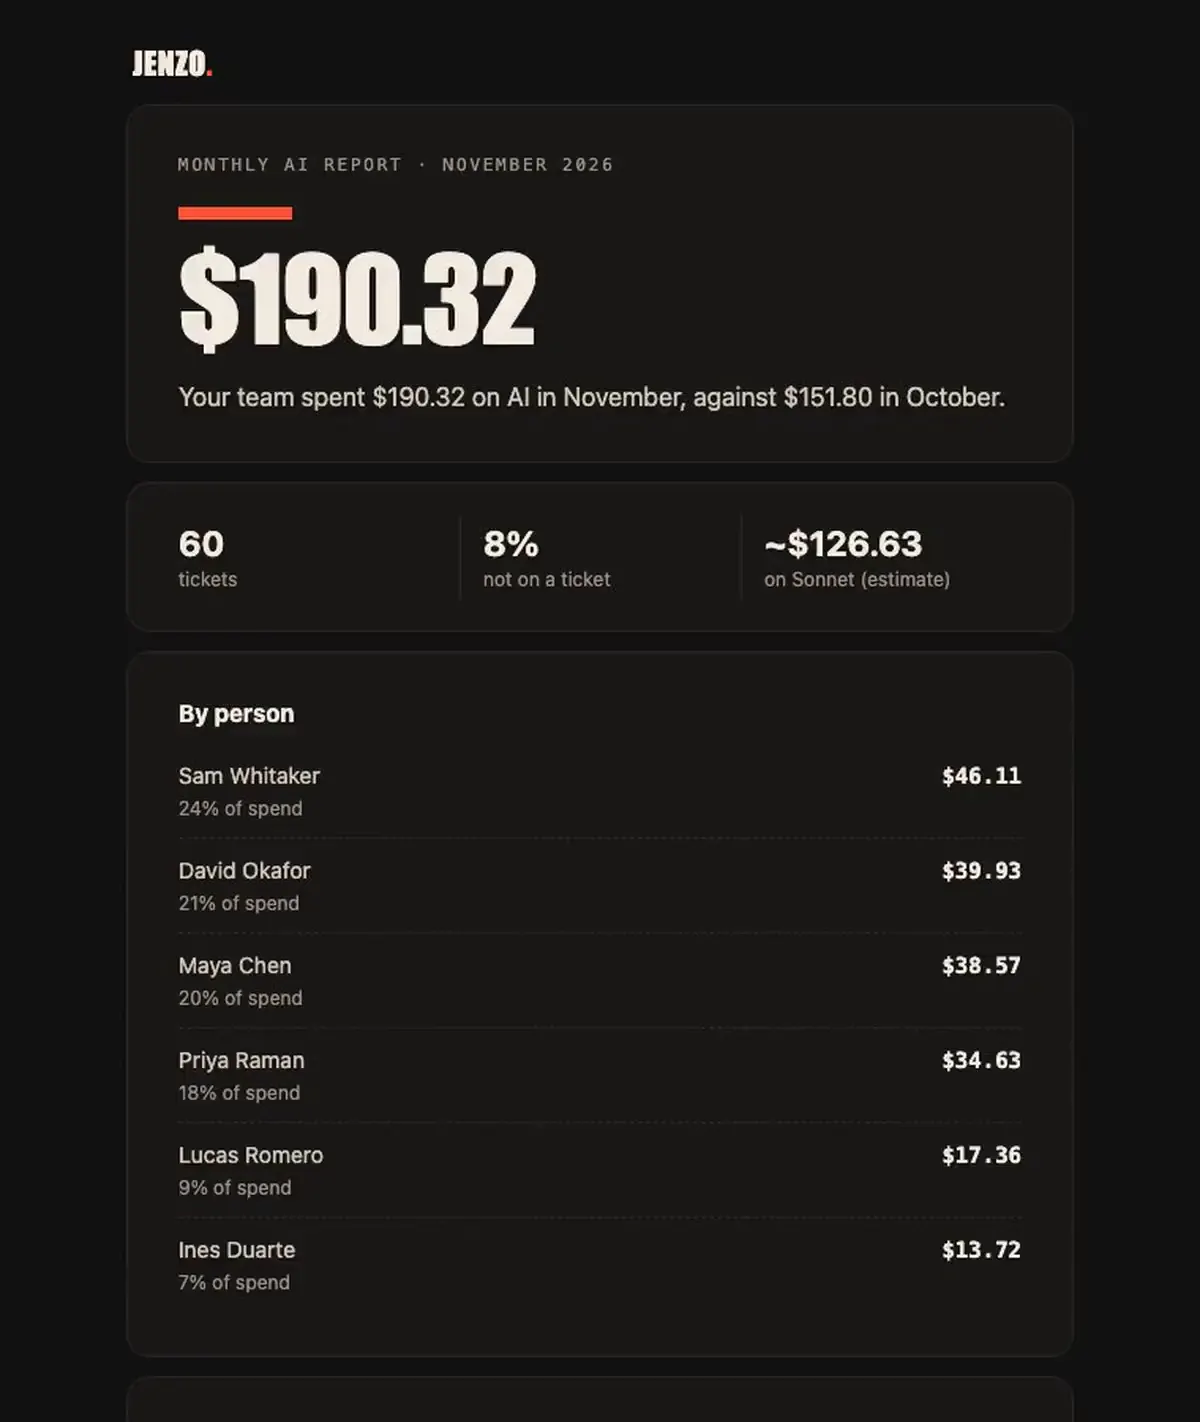
The monthly AI report breaks the team's AI spend down by person, and every figure is joined to the tickets that person's AI worked on. No leaderboard of raw tokens, a list of what the spend did.
Every tool in one view, down to a single ticket
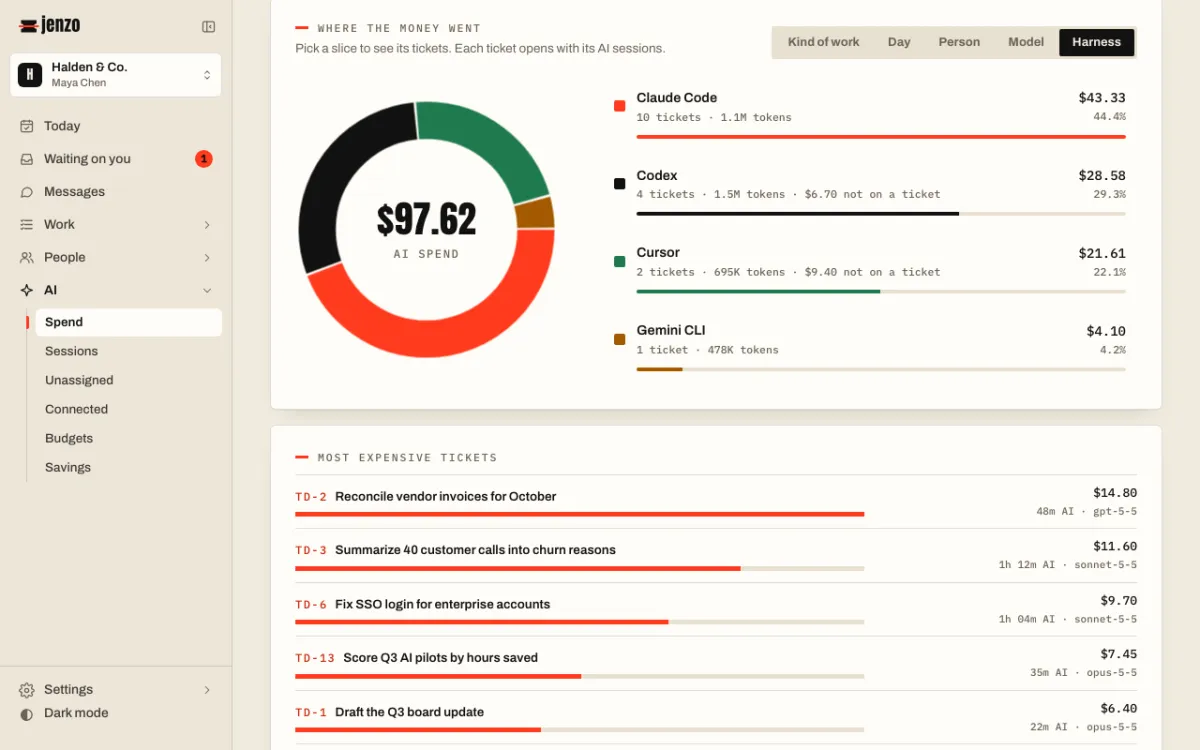
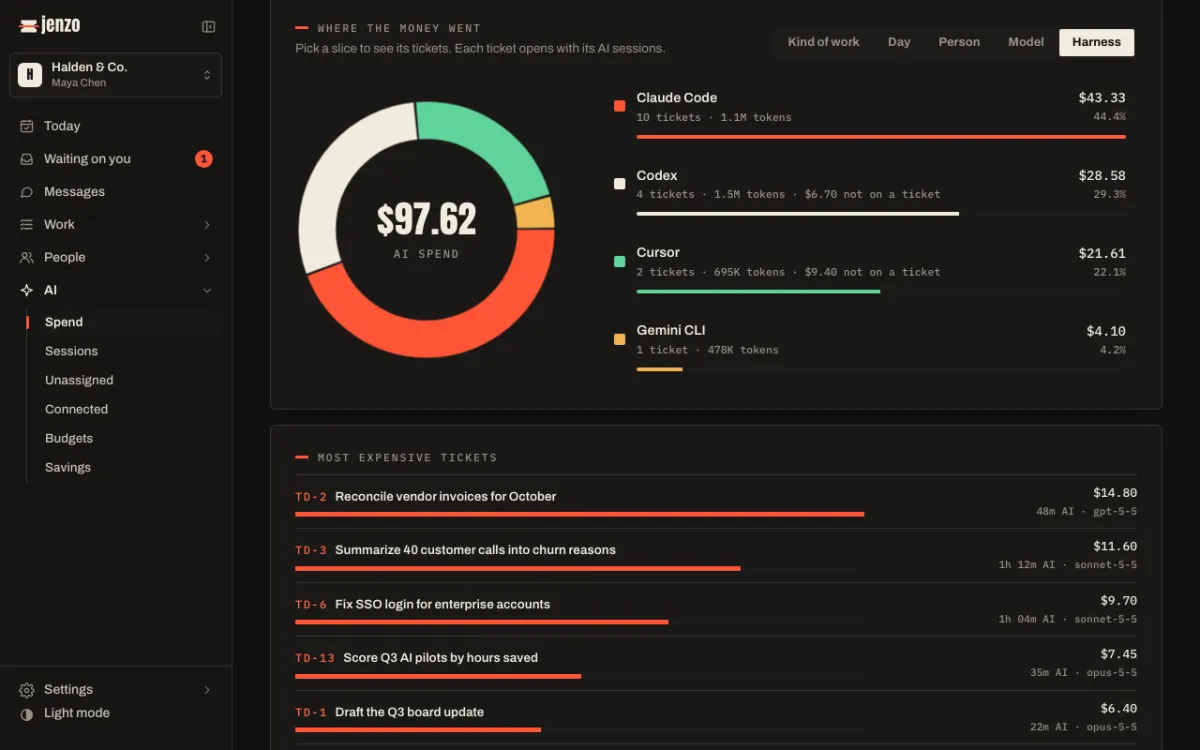
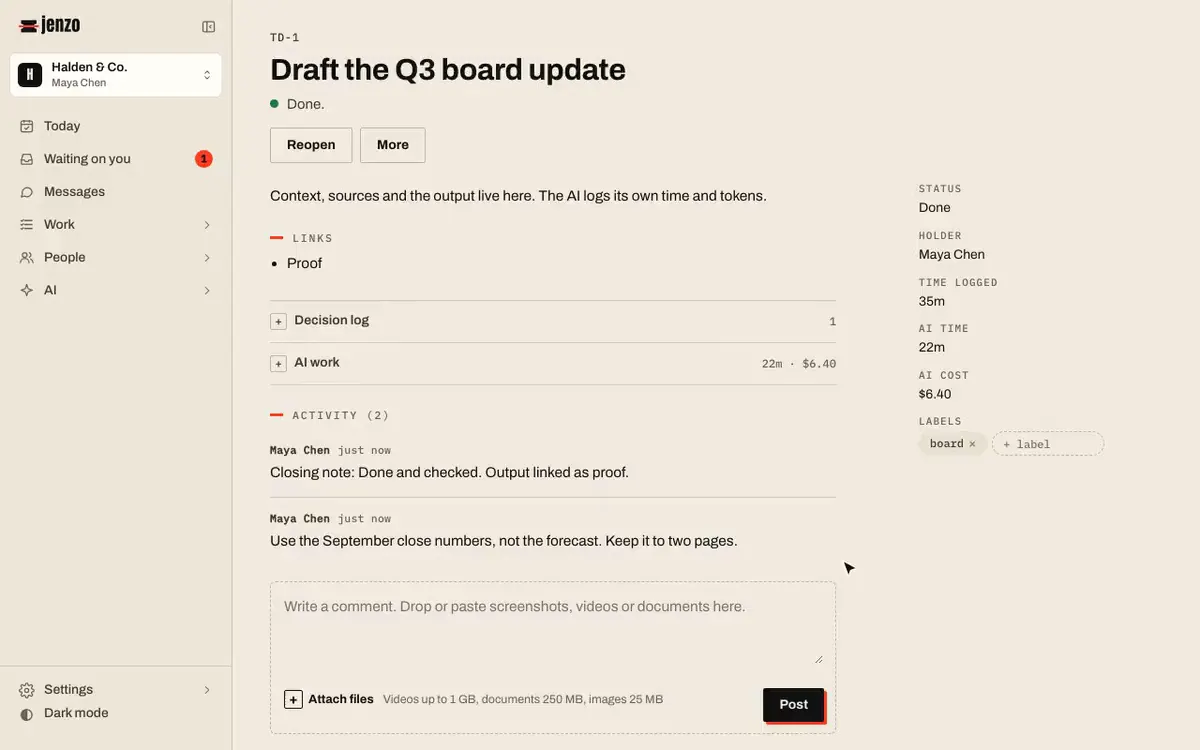
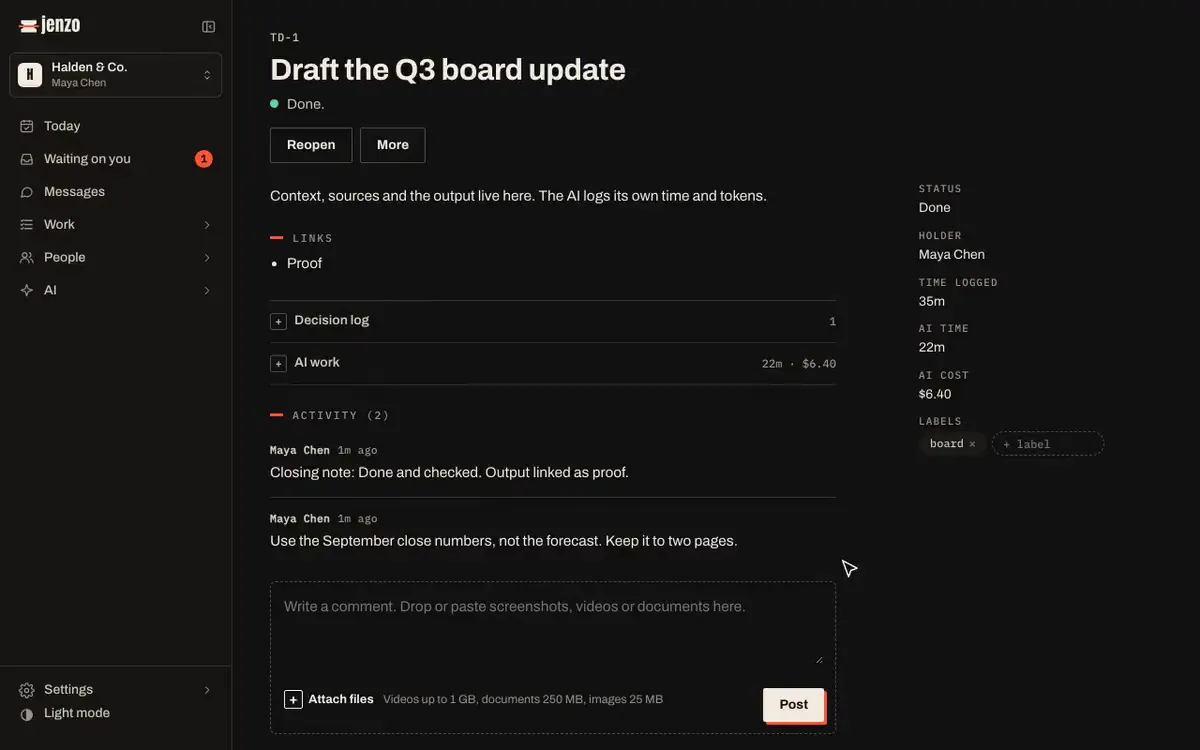
The Spend view splits the month by tool: Claude Code next to Codex, Cursor and Gemini CLI, each with its tickets and tokens. Switch the slice to Person, Model, Day or Kind of work. Open any ticket and you get its AI receipt: who held it, how long the AI ran, which model, and what it cost.
A per-developer total is a leaderboard. Measure what shipped.
A ranking of who used the most AI is the metric companies reach for first, and the one they regret. Amazon closed its internal token leaderboard after staff inflated their numbers, and its guidelines call token and code-change counts a deeply flawed measure of AI work. The same logic applies to a per-head usage total: it rewards spending, not shipping. Three numbers beat it.
- Cost per finished ticketWhat each developer's shipped work actually cost in tokens and dollars. This is the number you can put next to the value of the work.
- Spend by kind of workA bug fix, a feature, a migration, a report. A per-developer total treats them the same. They are not the same, and the mix tells you more than the ranking.
- Usage across every toolClaude Code, Codex, Cursor and Gemini CLI in one number per developer, so a switch of tool does not hide the spend in a dashboard you forgot to open.
More on this in our research on the 2026 AI spend cap wave and the AI coding price index.
How it works
Connect
Connect the Jenzo MCP to Claude Code with one command, claude mcp add jenzo. Codex, Cursor and Gemini CLI connect the same way.
Work as usual
Each session records its own time, model, tokens and cost against the ticket it worked on and the developer who ran it. There is nothing to tag by hand.
See the usage
Usage per developer, per ticket, per tool and per kind of work, plus a monthly AI report you can send up the chain.
Cite this page
Jenzo (2026). Track Claude Code usage per developer. https://jenzo.ai/use-cases/track-claude-code-usage-per-developer.
Free to quote with a link to this page.
Questions
How do I track Claude Code usage per developer?
Connect the Jenzo MCP to Claude Code with one command, and each session records its own time, model, tokens and cost against the ticket it worked on and the developer who ran it. You then see usage per developer, per ticket, per kind of work and per tool, plus a monthly report. It works the same way for Codex, Cursor and Gemini CLI, so every developer's AI coding usage sits in one view instead of four.
Does Claude Code have a usage dashboard?
Yes. On the Team and Enterprise plans and in the Claude Console, Anthropic shows Claude Code usage per named user: sessions, lines of code, commits, tokens and estimated cost, with a Claude Code Analytics API for the same data. What it does not show is which ticket or kind of work the usage was for, whether that work shipped, or anything about Codex and Cursor. That is the gap Jenzo fills.
Can I see Claude Code usage by team member?
In Jenzo, yes, by the person who ran each session. The monthly AI report lists spend by person, each figure joined to the tickets that person's AI worked on. Because Jenzo records the session from the tool itself over MCP, it also sees work run on a personal Claude Max seat, which an organisation's admin dashboard does not count.
How do I see Claude Code usage on a shared API key?
A shared key is the blind spot in Anthropic's own analytics: usage collapses to one key, not a person. Jenzo records each session from the Claude Code instance that ran it, so the developer who ran it is attached whether the key is shared or personal. You get per-developer usage without giving every engineer a separate key.
Does Claude Code analytics show cost per developer?
Anthropic reports an estimated cost per named user on org plans. Jenzo reports cost per developer too, and ties each dollar to a ticket, a kind of work and a client, so the number answers what the spend got done, not only who spent it. Costs come from the real tokens and model on each session.
How is this different from Claude Code's own analytics?
Claude Code's analytics measure consumption: sessions, lines, tokens and cost per user. Useful, but a ranking of who used the most is a leaderboard, and Amazon's own guidelines call token and code-change counts a deeply flawed way to measure AI work. Jenzo attributes every session to the unit of work it did, across Claude Code, Codex, Cursor and Gemini CLI, so you can read cost per finished ticket instead of a per-head total.
Can I track Codex and Cursor usage the same way?
Yes. Connect the Jenzo MCP to Codex, Cursor or Gemini CLI the same way as Claude Code, and each one records its own time, model, tokens and cost per ticket and per developer. The usage view shows all of them side by side, which no single vendor dashboard does.